
Harris County Crash Statistics (2018 - 2022):
Before and After The Pandemic
My idea for this project originated from multiple sources of anecdotal evidence; that the traffic and crash rates in Harris County, Texas, have increased since the Covid-19 Pandemic. This project involved gathering 5 separate years of data from the Texas DOT's Crash Records Information System (CRIS) through personnel query requests; in order to view and compare trends between different metrics from their database. Some of these metrics included information about the roadways and their conditions, drivers, occupants, and vehicles involved in the crashes.
Final Product Examples


Part 1: Gathering and Preliminary Testing of The Data

I started off this project by requesting 5 year's worth of data for Harris County
crashes, in separate 1 year increments, since this was the limit that the Texas CRIS
system would allow. Each file was password protected, and came in two separate
zipped folders containing csv files.

In each of the year's zipped folders, the first one contained data from Jan 1st to
around October 11th or 12th, and the other zipped folder contained the rest of the
year's data.


After reviewing the csv files, I decided which groups of files that I would be
interested in using for this project (crashes, units, etc...), and created year-specific
folders in which I could combine the two split csv files for each year. I decided to not
use the Charges or Damages files, since these just had the crash ids and a text
based description column. It would have been very inefficient to try and clean these
text columns, due to the tens of thousands of separate comments with misspellings,
abbreviations, and repeated comments with only slight variations. I also did not
believe that I could use these text based columns in any visualizations or matrices,
due to the amount of separate items that would have been present after cleaning.
Thankfully, there was an ID based column in the Units table named Contributing
Factor, that I was able to use instead.
After completing the year-specific folders, I then decided to combine all 5 years of
data for each specific category into an "All" folder. The Lookup folder did not require
this, as the ID Lookup table was consistent across all years.

During my preliminary testing of the data; as I explored the csv files and placed them
into Power BI to create test visualizations, I noticed that the original ID Lookup table
would not work for my visualization purposes. I would need to have the rows
transposed into unique columns, and have the IDs staggered, since the ID numbers
were not unique for each category. Nearly all of the categories used IDs between 0-9
or so, and 95-99 for some Unknowns or Not Applicables.

In order to transpose and stagger the data, I used the the excel Unique function to
grab all of the unique row names, then the transpose function to turn them into
columns. Afterwards, for the new ID columns, I copied and pasted "values" to make
sure that the column names wouldn't be overwritten.

I then used an If function [=IF($E$1:$CQ$1=A2,B2,"")] to check whether the column
names matched with the original Category column's rows. If they matched, it would
return the ID number listed next to it. After this step, I copied all ID values in the
newly transposed and staggered table, and pasted them as values. Lastly, I selected
the transposed and staggered ID values again, including all blank cells in the array
between them, and used Go To: Special: Blanks, and assigned them as ="NULL".

The final product of the ID Lookup table now included staggered ID numbers that
would not overlap, NULL values that I could easily trace and fix if other issues
persisted in the visualizations stage, and Descriptions that were linked by Row to
these ID numbers.
Part 2: Cleaning and Finalizing The Data

Due to many issues with MySQL's free workbench app, I had to use the updated ID
Lookup table to perform XLookups for the Crashes table, instead of joins in MySQL. I
moved a copy of the ID Lookup worksheet into the Crashes csv workbook, and then
performed XLookups for the columns that I was interested in potentially visualizing.
In order to sort these alphabetically in Power BI, for ease of finding the categories, I
added an "A_" to the beginning of each ID column that I was using an XLookup for,
and created a blank column labelled "CAT_" to distinguish these as the categories
that would contain the linked descriptions from the XLookup.
As stated above, I ran into many issues while using the MySQL free workbench app. Therefore, I researched some workarounds that would attempt to help save time and allow me to use SQL for joins and other data checks, instead of manually linking and cleaning data in excel which would have been less efficient; as I was forced to do for the Crashes table data.


The main workaround (and best I've found for importing data into MySQL) is a
Notepad++ plug-in called CsvLint. This plug-in allows the user the option of checking
all data types from the values before importing into MySQL, and creates an entire
script that inserts the table, columns, and values in a batch size of your choice.
MySQL Workbench's import wizard has been extremely ineffecient and crashed
many times throughout my project work, which is why I ended up using the CsvLint
plug-in instead. Due to the size of the data being imported through the scripts, there
were still issues with MySQL exhibiting extreme lag (upwards of 10-15 minutes just
to copy, paste and start running the scripts in MySQL) and crashing. I was unable to
import the Crashes table due to it's near 1GB data size. One of the main data
cleaning portions that I completed on these scripts, in Notepad++ (before
importing), was to change a few column data types to text. The other main cleaning
that I completed at this stage was to remove "/" and "\" characters that were not
meant to be present at the beginning or end of a text segment, which would
prematurely end the MySQL script's string section.
In the MySQL portion of this project, my main focus was to explore the data to gain some insights, check for any other data cleaning still needed, and to create the linked Descriptions from the ID Lookup table to each category's ID numbers. I included the majority of my SQL script in the images in this section, which also included some notes detailing the process and important things to note. Some parts were left out, since there would have been repetitive entries (for the Persons and PrimaryPersons tables for example).
Please note that, for display purposes on this website, some of the blue comment texts are separated onto new lines at unusual spots. This was done in order to keep the size of the text between these SQL screenshots relatively even, due to the website's somewhat rigid design options for Fitting and Filling pictures into the boxes. I am sorry if this makes the SQL script portion of this project a bit less smooth to read.

After importing 6 of the 7 tables into MySQL (excluding crashes) from the
Notepad++ scripts that were created, I then proceeded to detail some important
notes about the relationships that are present between the tables. In case there are
clarity issues from the pictures, I will detail a synopsis below.
The only primary key that existed between the tables was from the crash IDs that
could be linked to the Crashes table (excluding the Lookup table). In the Crashes
table, there are 638,867 unique crashes, and every other table includes the details
of the crashes based off of the crash ids. In the other tables, nearly all crash ids are
repeated at least once, in order to provide separate details for each driver, vehicle,
and potential passengers present in the crashes.

In this first portion of SQL script, I started off by double checking the tables' data and the names of the columns that I wanted to join in the Select * statements. I then proceeded to join the Driver's License Restriction IDs from the Restrictions table with the Description of these linked ID numbers from the ID Lookup table.
The Select Count portions were used as a way for me to double check that no entries or ID links were missed, and that all IDs and Descriptions were linked correctly.
After I felt confident in the results, I proceeded to remove the _record_number column. This column is automatically created by the CsvLint plugin to act as a primary key for the table, but was unnecessary since the crash ids would be used as the foreign key to be linked in Power BI. I then removed the original Restrictions table that I imported through a SQL Script, and replaced it with a now updated Restrictions_Updated table that I renamed to the original Restrictions.

In this next comment block I explained that I will be querying the Persons, PrimaryPersons, and Units (vehicles) tables next. The Persons and PrimaryPersons tables had many similar columns, although the PrimaryPersons had a few extra columns, such as Alcohol Test and Results, which were specific to the driver of the vehicle.
I also explained the initial data checks and updates that I made, including changes to the ID Lookup table and Crashes tables.
Lastly, I described the Persons and PrimaryPersons tables here.
The Persons table provides details related to all other occupants in the vehicles
involved in the crashes.
The PrimaryPersons table provides details specific to the drivers of each vehicle
involved in the crash.


In this next section of querying the Persons table, I noticed an issue with a date of 1899-12-30 being input next to some of the Time columns. From my research, I believe that this is a Csv file encoding issue that sometimes happens when only Times are present in the column. I proceeded to fix this issue and perform some general checks on the Prsn_Death_Time column afterwards.
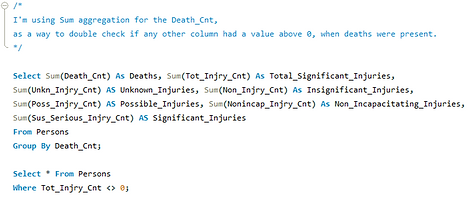
I noticed a section of columns relating to counts of different types of injuries and deaths, so I decided to query these and see how they were related to each other. I grouped each of these columns based on the death count, to see if any of the other columns had a value above 0 if a death was present. When a death was present, all other columns had values of 0.
I noticed that the Total Injuries comprised only the Non-Incapacitating, Possible, and Suspected Serious Injuries columns. Non-Injuries, Unknowns, and Death counts were not included in Total Injuries.

For ease of viewing the querying, I decided to create a temporary table for a case method, that only included the injury and death columns I was looking at. After some other groupings and checks on these numbers were done, I deleted the table to save storage space and prevent future confusion from having excess tables created.

In the previous queries, I'd seen that some ages were left blank, which may have signified Unknown ages by the investigator at the scene. I decided to query this as well, and check the other columns to see if there were any determining factors that would explain these blank ages. I did not find anything that related to these blank ages.
In this portion of my SQL querying, I started joins between the ID Lookup table and the last three tables that still needed joins (PrimaryPersons, Persons, and Units). I've displayed most of the joining portions for the Persons and Units tables only, since the PrimaryPersons table was very similar to the Persons table. I also discovered a more efficient method for joining the columns with a wildcard in the Units querying, which I will explain further below.

This text comment explains some issues that I ran into when attempting to join the ID columns from the ID Lookup table to the ID columns in the Persons table, with matching descriptions. I was unable to join more than 5 or 6 columns at a time, without MySQL being unable to complete the action or crashing the program, even after allowing up to 1500 seconds for the action to be completed. Funnily enough, once I lowered the joins from 7 down to 5 or 6, it only took about 30-50 seconds for the joins to be completed.
After attempting to edit the my.ini config file for MySQL in Notepad++, I was no longer able to use the program due to a bug with editing the config file. I restored a backup of the original my.ini file, and then used a hex editor instead of Notepad++, as I'd heard this could work as a solution to the bug. Unfortunately, even after editing the configurations and allowing MySQL to use more resources for the join buffer size, and allocating more resources for other options, this did not fix the original problem that limited the amount of joins I could perform.

In this portion of querying with multiple joins, I accidentally started off with a more time consuming method. This method involved listing every column from the Persons table, in both the 1st and 2nd Persons table joinings. MySQL would only allow me to join 5 or 6 columns at a time, but I wanted to join 9 total columns from the Persons table to the ID Lookup table. Therefore, I had to split the joining of the ID columns and descriptions into two separate Persons tables, that I would then join afterwards for a finalized table, due to the aforementioned issue above.


After the two split Persons tables had their descriptions merged from the ID Lookup table, the next step was to join these two Persons tables together.
In this case, because I'd used an inefficient method of listing all columns for both split tables, I was forced to choose P1 and P2 as the aliases for specific columns, so that I didn't receive a duplicate column name error when joining. I chose to use P1 for the first half of the columns in the original Persons table, and P2 for the second half of the columns. There was no difference in the content, or accuracy of the data, since these values were being joined based on the _record_number column. This column, created by CsvLint, acted as a primary key that the original table data could be joined on for the two split tables.
After the split tables were joined, and I double checked that the data was accurate, I then deleted the split tables, the original Persons table, and renamed the now updated Persons_Updated table back to the original Persons name.

After I completed my joining and querying for the Persons and PrimaryPersons tables, I exported them both from MySQL's export to csv function.
Unfortunately, due to the size of the PrimaryPersons table (about triple the size of the Persons table), the csv export did not complete the full export. Re-exporting did not fix this issue, so I decided to double check what was exported. During my csv and Notepad++ check, I noticed that the columns, the data within them, and the rows were all correct. The issue was that MySQL could not export the entire file, so about 32,000 rows still needed to be exported.
I developed a solution to this problem by creating a new table, labelled "Primary_Fix", that contained the last 32,000 rows of data from the updated PrimaryPersons table. I then exported this table, checked the data, and copied and pasted it into the bottom of the main csv file (through Notepad++ due to excel's row limit).

Similar to the joins and table splitting that I performed for the Persons table, I repeated a similar, but more efficient process for the Units table. This table had about 3x the number of columns as the Persons table, and the thought of typing each of these columns across the split table joins prompted me to research and adapt a solution if possible. I still had to type out the columns across the initial split tables, but the final joining of the split tables was significantly easier, due to the wildcard solution.
For this solution I realized that, as long as the primary key _record_number had a new alias for each split table, and every column was listed at least once across each of the split table joins, then there would be no duplicate column names or loss of data. I just had to keep in mind to delete the extra aliased record columns later.

For these split table joins, in contrast to the inefficient Persons table process, I decided to list sections of the columns from the main Units table into the 6 split tables. At the end of the 6 split tables, every column from the original table would be listed, with the addition of a few "duplicate" record numbers, that I could delete from the final updated Units table. This way, I did not need to type out every column for every table, which would have made the wildcard solution impossible.
I've decided to display the first 2 split Units tables only, since the rest of the process is nearly identical and would be repetitive to view.

As stated above, this text comment block simply states that I can perform the wildcard method with "duplicate" record columns aliased into each split table. I named these record columns _record_number (original), record2, record3 ... up to record6.

Because there were 6 split Units tables that I needed joined, but MySQL only allowed me to join 5 items without timing out or crashing, I resorted to joining the split tables into a finalized and updated Units table in two parts.
With the Select * wildcard, I was able to join every column from the first 4 split tables into the Units_Unfinalized1 table first, and then append this unfinalized table to a new Units_Updated, which contained the last 2 split tables.

After determining the validity of the Units_Updated table; I decided to create one more backup before I removed the extra record columns, and before getting ready to export the table to a csv file in my final steps.

After checking the finalized Units_Updated table, once the extra records were removed, my last step was to replace the original Units table with this updated table, and export the new table to a csv. In case another export issue arose, I decided to create one more finalized table backup.

As expected, an issue arose while exporting the finalized Units table to a csv file. I implemented the same solution as the PrimaryPersons table fix, which involved using Notepad++ to append the last 22,256 rows from the Units Fix table to the incomplete Units csv file.

After another validation check, to make sure that no data was missing from the now finalized and exported Units csv file, I removed the split tables and backup tables that were no longer necessary, to save space in the database.
Part 3: Visualizing The Data
Other than the initial data cleaning and merging IDs with Descriptions, there were a few data entry issues that I encountered during the visualization portion of this project. These included the Investigator Arrival Times, Driver and Occupant Ages, and Speed Limits.


I noticed that the Investigator Arrival Times sometimes had issues regarding the correct date being input, if the crash occurred close to 12:00 AM. I'm not sure if this was an issue with the investigator's data entry, or the system that they use, but sometimes the dates for the notification time and arrival times would be identical. As an example, if an investigator was notified of the crash at 11:55 PM on 1/20/2022, and arrived at the scene of the crash at 12:10 AM on 1/21/2022, the arrival date would still be entered as 1/20/2022. This led to 3,539 irregular negative values in the arrival time, which is about 0.55% of the entire crash data.
Another issue regarding arrival times involved some times exceeding 200 or 300 minutes. I do believe that many of these values may in fact be accurate, due to potential traffic or road safety concerns where the crashes occurred, however I chose not to visualize them. There was a low occurrence rate (2,857 crashes - 0.45% of the entire crash data), and including these times would have impacted the "Crashes by Investigator Arrival Time's" x-axis and look of the data significantly. I instead chose to only include arrival times that were between 0 and 120 minutes.
The issues I noticed regarding ages involved were in relation to the number of values above 110 years old, and possibly the number of values below 10 years old (specifically for the Driver's Info page). It is possible that some young kids took their parent's vehicles for a joyride, or that these kids accidentally crashed the vehicles just outside of the parent's homes. In regards to those older than 110 years old, this number seemed significantly incorrect. The current oldest man and woman in the world are respectively 113 and 116 years old, however the crash data showed that there were 168 people grouped into the 115, 120, and 130 age bins. I believe that these ages were entered incorrectly, possible meant to be grouped into the 15, 20, or 30 age bins. Therefore, I decided to only display the ages between -5 (Unknown) to 110 years old.
The speed limit issue that I noticed was simply that many speed limits were left blank, instead of listed as a negative value to be "Unknown", per the investigator's reporting standards. For these speed limits that were left blank, I labelled them with a negative value so that they could be displayed properly.
Due to the large amount of data, and the amount of categories in the tables, there were few graphs in which I was able to create clean displays with multiple categories on the x-axis. There was only one graph in which I created parameters for, which was the "Crash Injuries and Deaths" graph on the Vehicle's Info page. In this graph, the Total Injuries relates to the sum of Non-Incapacitating, Possible, and Suspected Serious injuries. The Non-injuries and Unknown injuries are considered separate, as well as the Deaths (since these would take precedent over all other injuries).
Through the use of a customized pop-out filter menu and parameters (when necessary), I was able to gather insights into how crash rates have changed before and after the covid-19 pandemic.
Here are some details regarding the customized pop-out filter menu:
-
Some filter options were consistent across all pages, while others were changed so that page specific metrics could be viewed in greater depth. One consistent filter was the Timeframe (Years, Quarters, Months), and one page specific filter was the Alcohol Test Result (on the Driver's Info page).
-
The Bookmarks and Selection menus were used to create these filters for buttons, and they were set to update based on the Data or Display of selected visuals, for each current page.
-
In each of these filters, there are two buttons that reset the slicers, two buttons that can minimize the filter menu to display the filtered data, and one button to open the filter menu. When resetting the slicers, one option is available in the filter menu, and one option is available in the "Filter Hidden" page.
Here are some insights I've gathered from the data:
-
Driver fatalities have increased by 34.9% between 2018 and 2019 to 2021 and 2022. Occupant fatalities have increased by 36.3% between 2018 and 2019 to 2021 and 2022. l've excluded 2020 fatalities in this calculation due to skewed results from less drivers being on the road during the pandemic.
-
The number of recorded crashes has increased by 1,707 from the sum of crashes in years 2018 and 2019 to 2021 and 2022.
-
In each year, the highest amount of crashes occurred on Fridays in Harris County, Texas. The timing of these crashes had no significant difference between each year, with the hours of 3:00 PM to 6:00 PM being the most likely time for a crash to occur.
In the four pictures below, labeled 2018 Fatalities and 2022 Fatalities, I've shown one example of driver fatalities increasing from the year 2018 to 2022. I used the Timeframe and Injury Severity filters on the Driver's report page to display this.
2022 Fatalities: Filter Hidden

2022 Fatalities: Filter Displayed
